changes.mady.by.user weweave UG
Saved on Jun 11, 2021
Saved on Sept 28, 2023
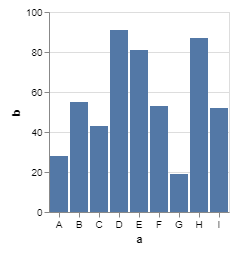
Data can be visualized as bar charts. Click here to see the live demo.
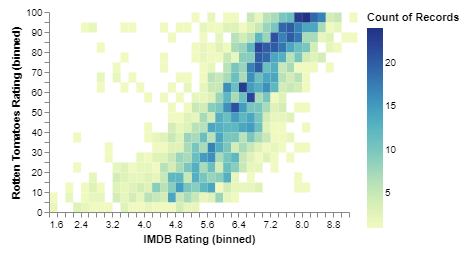
Data can be visualized as heatmaps. Click here to see the live demo.
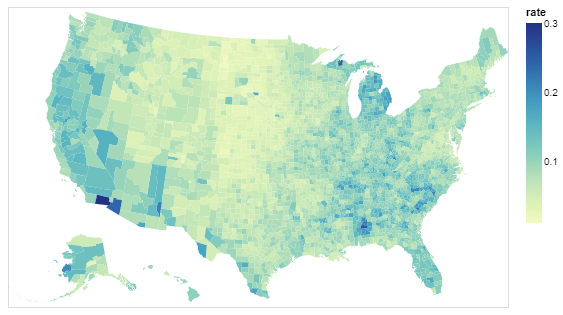
Data can be visualized as geographical maps. Click here to see the live demo.
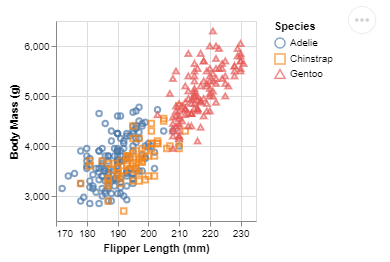
Data can be visualized as colored scatterplots. Click here to see the live demo.