You are viewing an old version of this page. View the current version.
Compare with Current View Page History
« Previous Version 3 Next »
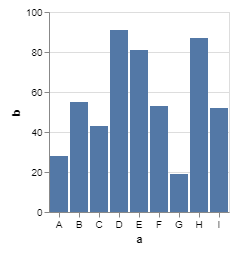
Data can be visualized as bar charts. Click here to see the live demo.
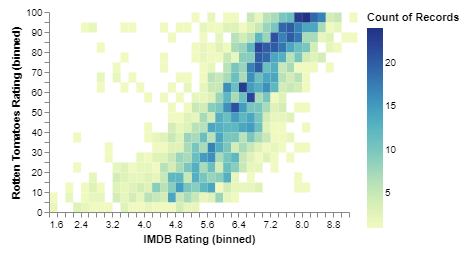
Data can be visualized as heatmaps. Click here to see the live demo.