You are viewing an old version of this page. View the current version.
Compare with Current View Page History
« Previous Version 4 Next »
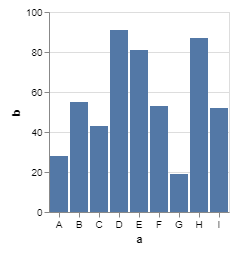
Data can be visualized as bar charts. Click here to see the live demo.
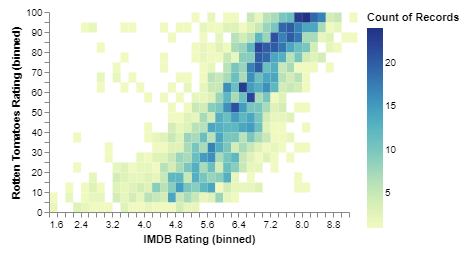
Data can be visualized as heatmaps. Click here to see the live demo.
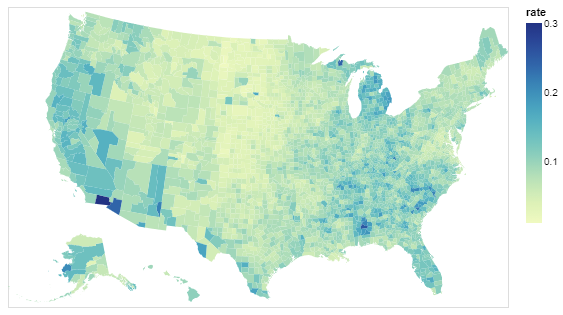
Data can be visualized as geographical maps. Click here to see the live demo.